Usage
Plots
All nxviz plot objects take in a Networkx graph object and output a plot object. The following examples will use a randomly generated Networkx graph. The following code uses Networkx’s built-in drawing function.
import networkx as nx
import matplotlib.pyplot as plt

er = nx.erdos_renyi_graph(30, 0.3)
nx.draw(er)
plt.show()
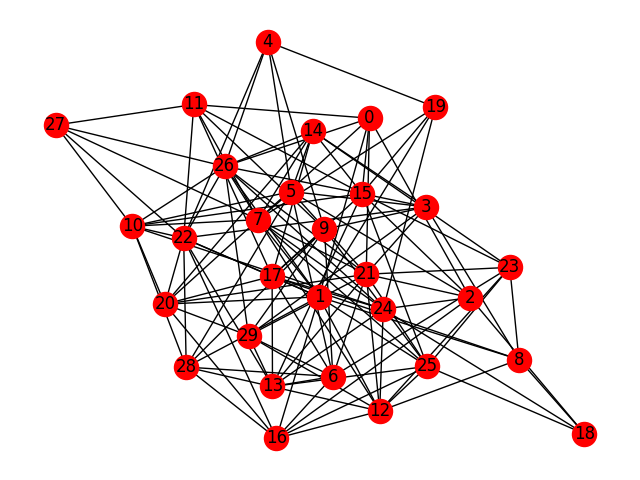
Networkx built-in draw function
Matrix Plots
from nxviz.plots import MatrixPlot
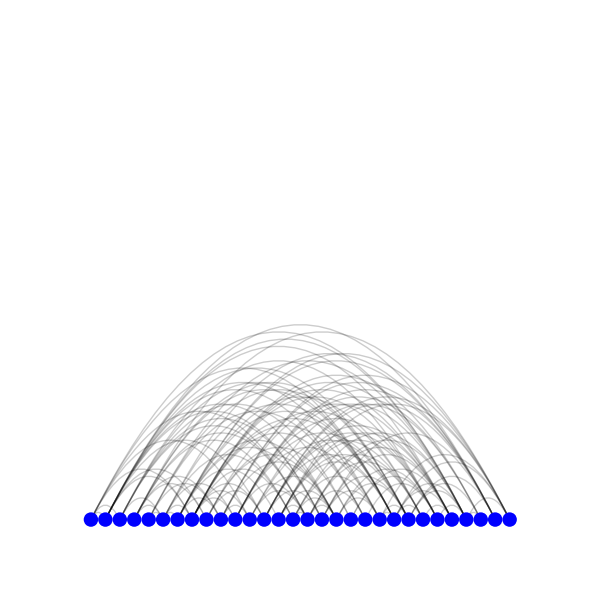
m = MatrixPlot(er)
m.draw()
plt.show()

nxviz matrix plot
Circos Plots
from nxviz.plots import CircosPlot

c = CircosPlot(er)
c.draw()
plt.show()
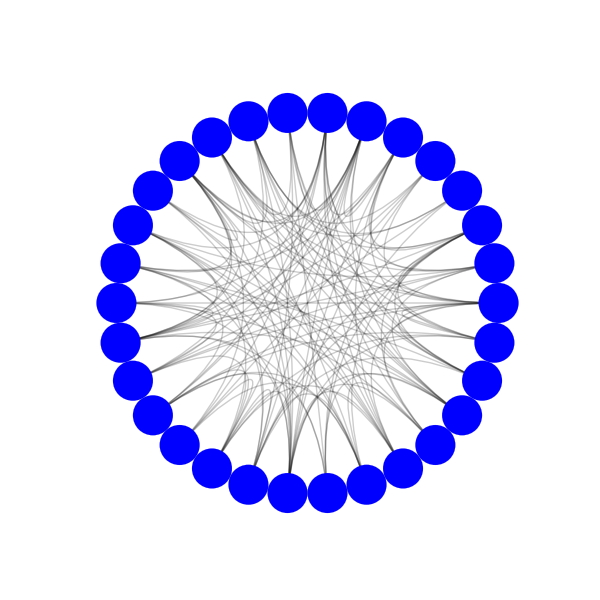
nxviz Circos plot
For a full list of parameters, see the nxviz.plots.CircosPlot API documentation.
The above is a basic overview of the available plots. For more detailed examples of these plots in action, please see the examples here.